
So that you do not form a superficial impression that stress and burnout revolve only around tachycardia, let us consider one more example (Fig. 3.18).
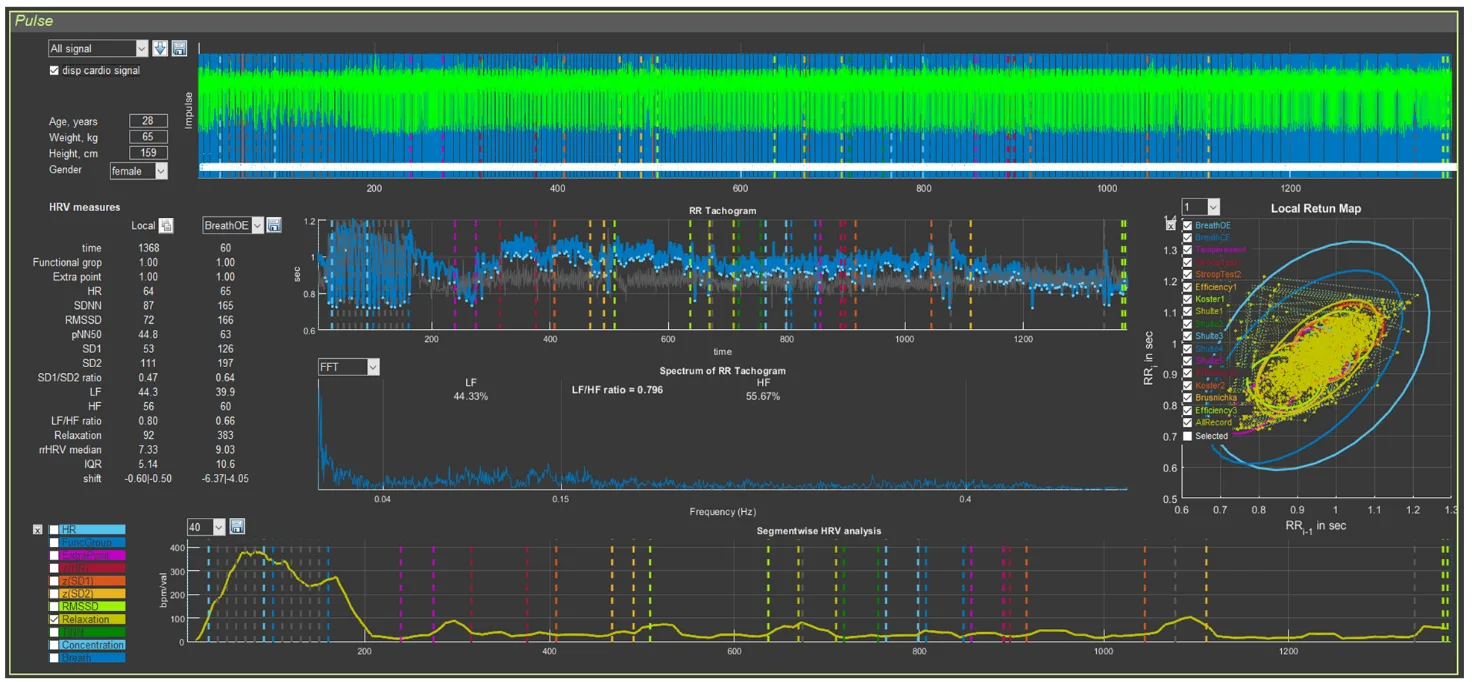
Figure 3.18. The respondent’s “Cardio domain” page (Example 2)
The first thing we pay attention to is the quality of the ECG recording. It is good, which allows us to draw conclusions not only from the report as a whole, but also from the data of the respondent’s autonomic reaction to Stressonika. The second point of our attention is the cardiointervalogram (Fig. 3.19b).
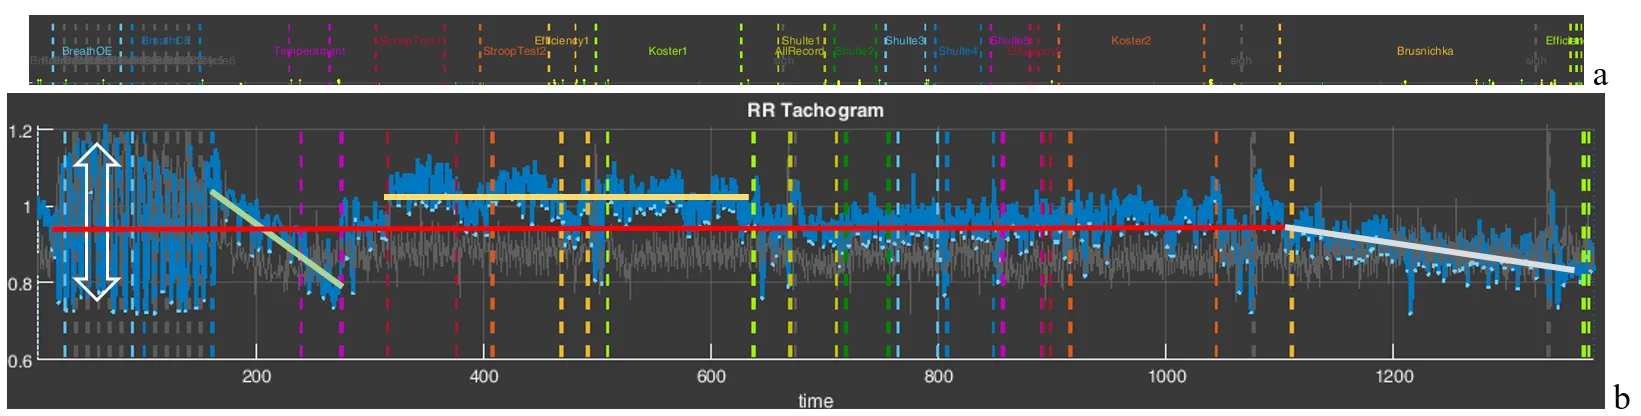
Figure 3.19. The respondent’s cardiointervalogram (CIG) acceptable for analysis (Example 2).
Note: a – an element of the “Time domain” page describing the testing stages in Stressonika.
What catches the eye on the CIG curve:
- a relatively low heart rate (HR), which is fairly stable throughout the entire testing time (the red line of the mean RR-interval duration is approximately at the level of 0.95 s, or, converted to HR, 63 beats/min);
- a wide spread of RR intervals at the breathing stages (the vertical bidirectional arrow);
- a certain increase in HR during the tapping test and during the last test, up to 60/0.8 = 75 beats/min;
- a decrease (!) in HR in response to the Stroop test and during the first 2-minute rest.
Let us check our observations against specific numbers using Sector 3 (Fig. 3.20).
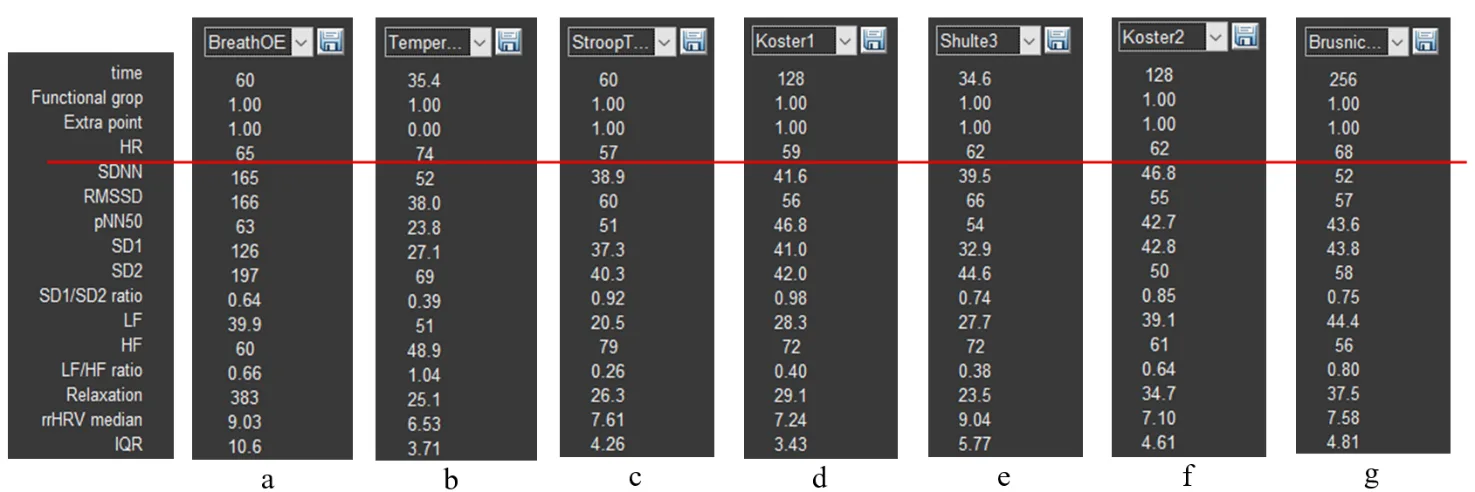
Figure 3.20. HRV indicators (Example 2): a – the stage of controlled slow breathing with eyes open; b – the tapping-test stage; c – the Stroop test 1 stage; d – the first rest stage; e – the stage of completing Schulte table 3; f – the second rest stage; g – the stage of completing the color test with names of fruits and vegetables.
The heart rate value in the last test is 68 beats/min (Fig. 3.20g), not the 75 calculated by us, because in our calculation we took the RR-interval value at the end of the test, whereas the HRV indicator table displays the average value over the entire duration of this stage.
The range of RR-interval duration at the controlled breathing stage with a frequency of 6 breathing movements is quite large, and the CIG clearly shows relatively rare oscillations of the cardiac cycle duration organized into a certain rhythm. However, we recommend always viewing this stage in CleverView. We remind you how to do this: in Sector 1, activate the slow breathing with eyes open stage that we need (this action will display the spectrogram of this stage in Sector 6; see Fig. 3.21b); in Sector 7, visualize only the “BreathOE” stage (Fig. 3.21c); in Sector 5, stretch the part of the CIG curve highlighted with a thicker line (Fig. 3.21a). The resulting image on the “Cardio domain” page is a clear example of why such a detailed analysis of the respondent’s response to the controlled slow breathing stage is necessary!
Let us sort it out.
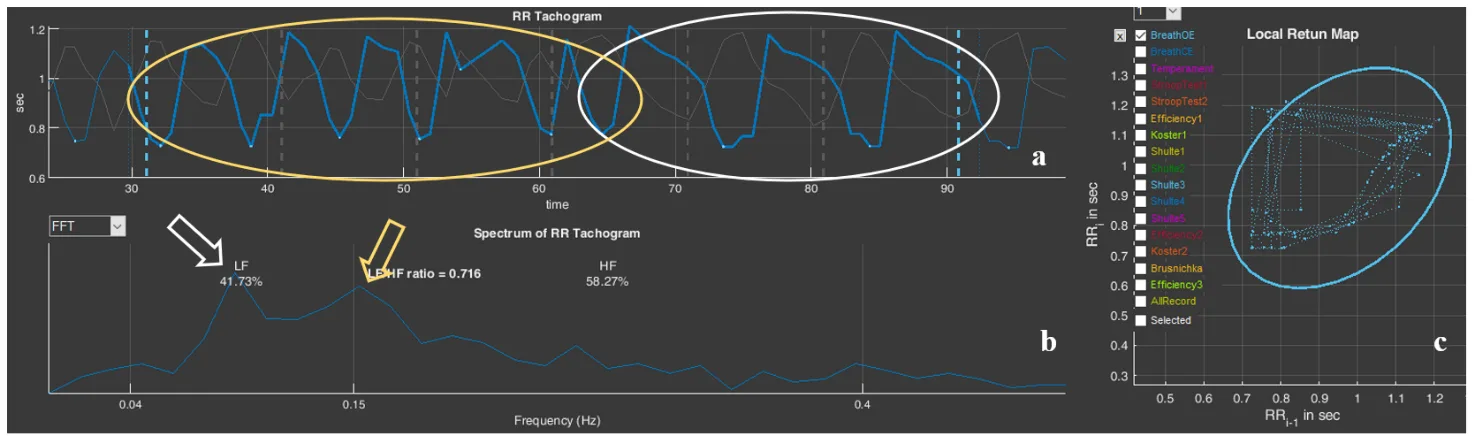
Figure 3.21. The respondent’s “BreathOE” stage (Example 2): a – cardiointervalogram; b – spectrogram; c – scatter plot
The cardiointervalogram curve clearly illustrates that the respondent was able to “pick up” the imposed breathing only in the second half of the “BreathOE” stage (in Fig. 3.21a, the area under the white oval), while at the beginning the breathing was more frequent (the CIG under the yellow oval in Fig. 3.21a). On the spectrogram, this moment is reflected by two corresponding peaks (Fig. 3.21b). The slow breathing with eyes closed stage (Fig. 2.22) emphasizes the nuance that it was more comfortable for the respondent—which was confirmed in the conversation after testing—to breathe at a higher frequency. On the spectrogram, only one peak at a frequency of 0.137 stands out, which corresponds to ≈ 8 breathing movements. These data may be useful when selecting individual approaches to certain breathing practices.
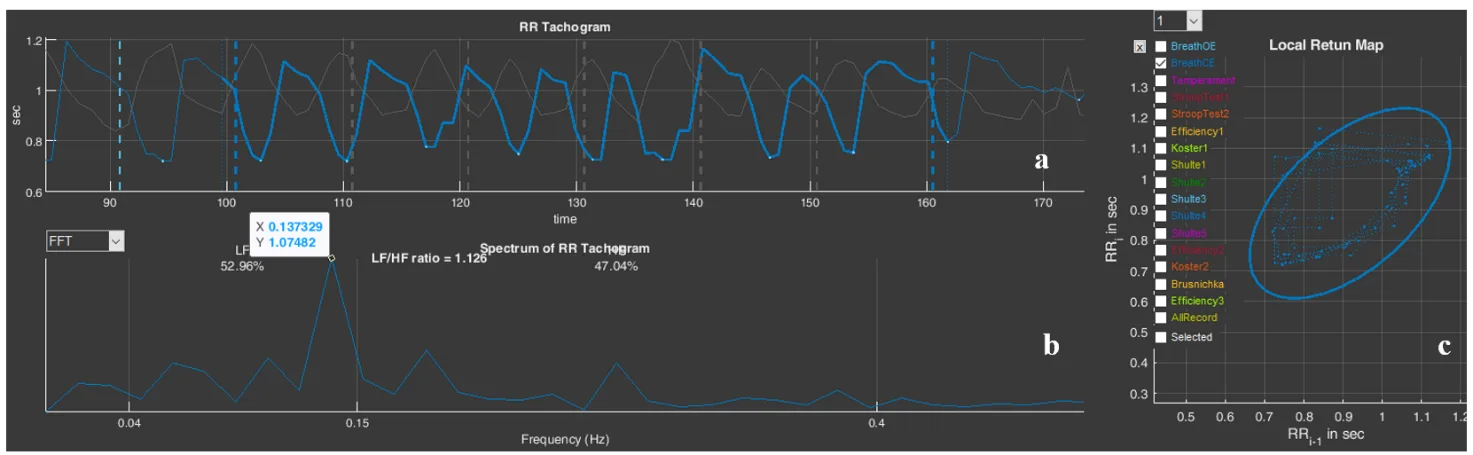
Figure 3.22. The respondent’s “BreathCE” stage (Example 2): a – cardiointervalogram; b – spectrogram; c – scatter plot
Moving on. The response on the part of cardiac activity (by the shape of the CIG) is not quite usual for Stressonika. Let us compare it with the results of the report (Fig. 3.23).
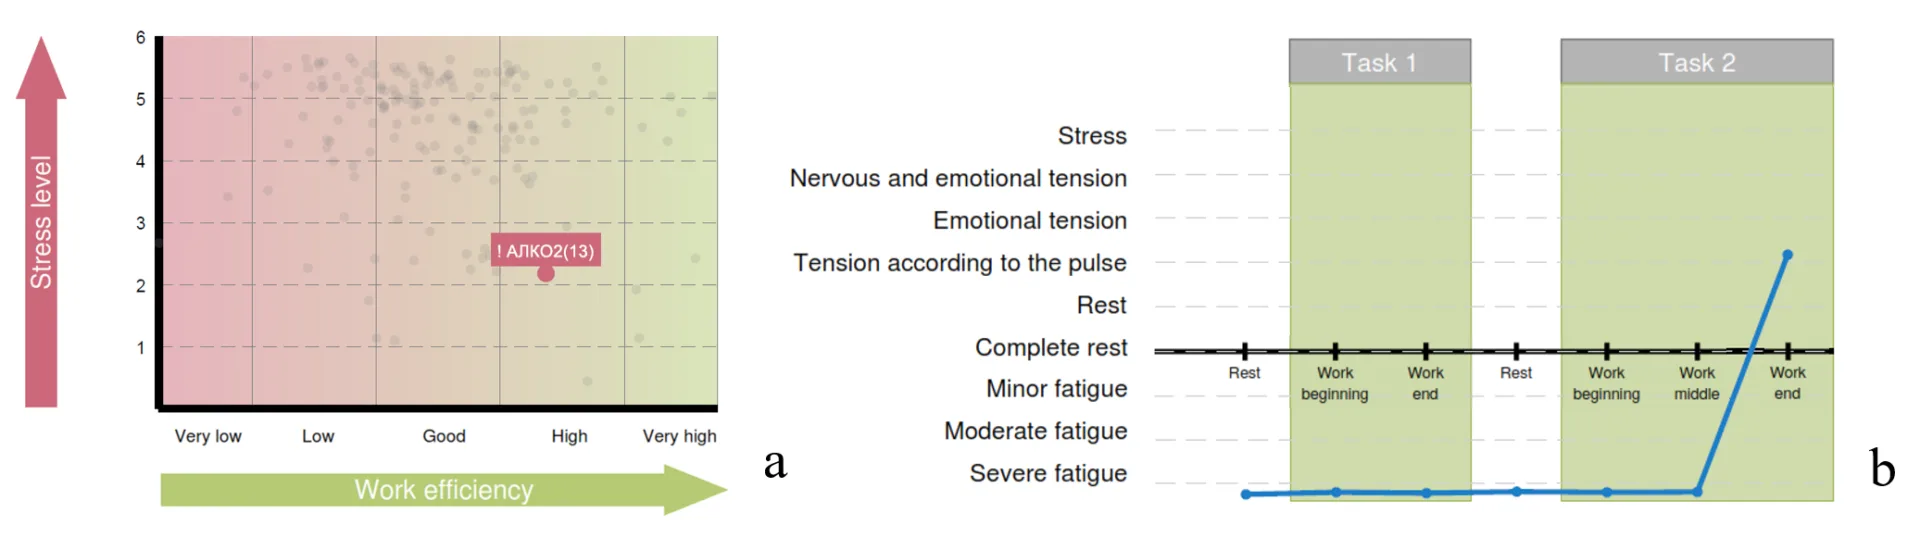
Figure 3.23. Diagrams of Chapter 3 of the report (Example 2): a – the functional type of performance support; b – the respondent’s functional states in the process of performing test tasks
A red zone with a low level of stress reaction severity (Fig. 3.23a) and a state of pronounced fatigue almost throughout the entire session (Fig. 2.23b). It can be assumed that the respondent’s functional state does correspond to what was identified in Stressonika, despite the respondent’s lack of complaints of fatigue. There are no contradictions in this combination, since the level of stress is most often determined by heart rate, but an HR at the level of 60 beats/min can be the result of activation of the protective parasympathetic nervous system against the background of chronic stress. To confirm this assumption, one of the rest stages can be considered in more detail, for example “Koster1” (Fig. 3.24).
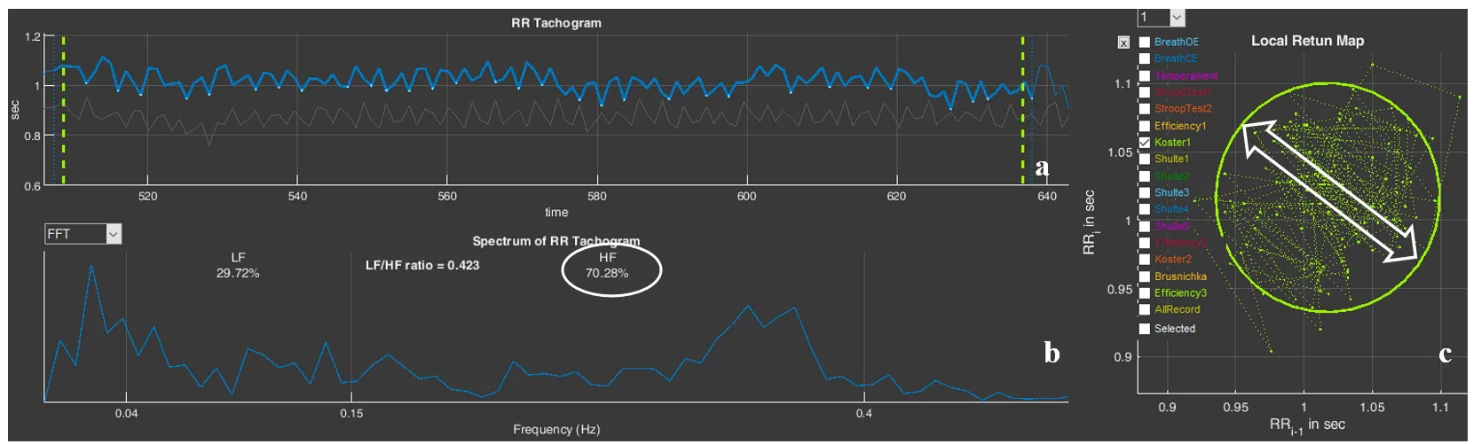
Figure 3.24. The respondent’s “Koster1” stage (Example 2): a – cardiointervalogram; b – spectrogram; c – scatter plot
On the CIG (Fig. 3.24a), there are no signs of respiratory arrhythmia, which should be observed in the case of balance between the sympathetic and parasympathetic nervous systems. On the spectrogram (Fig. 3.24b), there is a pronounced shift of spectral power toward high (HF) frequencies—70.28%. The scatter plot (Fig. 3.24c) forms not even an oval, as happens when the structures of the autonomic nervous system are balanced, but rather a circle, the conventional width (bidirectional arrows) of which corresponds to the SD1 indicator. These same indicators are present in the table of Sector 3 (Fig. 3.20d). Let us refer to Table 2.1 of Chapter 2: HF is a measure of the power of high-frequency influences of neurohumoral regulation, which is associated mainly with the parasympathetic link of regulation; SD1 reflects instantaneous changes in RR-interval duration, also related to the activity of the parasympathetic division of the ANS. The assumption of parasympathetic dominance is confirmed.
It can be concluded that the respondent’s organism, in response to the chronic stress in which they are at the time of testing, has reorganized to a different mode of functioning, in which increased activity of the parasympathetic division of the ANS is clearly traced. This is a protective adaptive reaction, which also influences the absence of formation of a feeling of fatigue.


