
Sector. 2Sector. 2Sector. 2Sector. 2
  • Book a demo
  • CleverLab
  • Stressonika
    • Use cases
  • Docs
  • Contacts
  • EN
✕

CleverPoint 4 User Manual

16
  • Introduction
    • Customer Support
    • Regulatory Compliance
    • Warranty and Copyright
  • Product Information
    • Product information
    • Technical specifications
    • Application compatibility
    • Safety precautions
    • Maintenance
  • Getting Started
    • Kit contains
    • Equipment Check
    • Types of CleverPoint 4 Indications
    • Charging your CleverPoint 4
    • Turning CleverPoint 4 on/off
    • First time Wi-Fi setup
    • Connecting CleverMask to the VR Headset
    • Connecting the ECG cable to CleverPoint 4

Stressonika - Guide for Working with raw ECG data

20
  • Introduction
  • Chapter 1. General points.
    • General points
  • Chapter 2. Cardio domain
    • Cardio domain
    • Sector. 1
    • Sector. 2
    • Sector. 3
    • Sector 4
    • Sector 5
    • Sector 6
    • Sector 7
    • Sector 8
  • Chapter 3. Cardio domain: examples
    • Cardio domain: examples
    • 3.1. ECG recording quality
    • 3.2. Preparing the “Cardio domain” page for consultation
    • 3.3 Viewing the “Cardio domain” page during consultation (Example 1)
    • 3.4 . Viewing the “Cardio domain” page during consultation (Example 2)
    • 3.5. Viewing the “Cardio domain” page during consultation (Example 3)
    • 3.6 . Viewing the “Cardio domain” page during consultation (Example 4)
    • 3.7. Viewing the “Cardio domain” page during consultation (Example 5)
    • 3.8. The “Cardio domain” page. Conclusion.

CleverPoint View Data v2.15 User Guide

55
  • Introduction
    • Introduction
  • 0. Fundamentals of Electrophysiology for Beginners
    • 0.1. What Are Physiological Signals?
    • 0.2. Autonomic Nervous System (ANS)
    • 0.3. Emotions and the Brain
    • 0.4. Electrodes and Their Placement in the CleverPoint Setup
  • 1. General Principles of Signal Processing
    • 1.1. Basic Transformations
    • 1.2. Marking and Trim
    • 1.3. CAR (Common Average Reference)
    • 1.4. Denoise (Blink Artifact Suppression)
    • 1.5. Normalize
    • 1.6. IMF (Empirical Mode Decomposition)
    • 1.7. Filtering
    • 1.8. Power vs Amplitude
    • 1.9. Epoch
  • 2. “Summary” Interface
    • 2.1. Purpose
    • 2.2. Controls
    • 2.3. Graphs
    • 2.4. Data Export
  • 3. “Time Domain” Interface
    • 3.1. Purpose
    • 3.2. Controls
    • 3.3. Signal Display
    • 3.4. Signal Transformations
  • 4. “Frequency Domain” Interface
    • 4.1. Purpose
    • 4.2. Interface Structure
    • 4.3. Controls
    • 4.4. Spectral Analysis Methods
    • 4.5. Channel Correlation
    • 4.6. Time Series
  • 5. “Power Domain” Interface
    • 5.1. Purpose
    • 5.2. “Power by sections” Mode
    • 5.3. “Between-channel interactions” Mode
    • 5.4. Frequency-Band Graphs
  • 6. “Coherence” Interface
    • 6.1. Purpose
    • 6.2. Controls
    • 6.3. Coherence Calculation Method
    • 6.4. Display
    • 6.5. Interpretation
    • 6.6. Use in Research
  • 7. “Emotional State” Interface
    • 7.1. Purpose
    • 7.2. Interface Structure
    • 7.3. Controls
    • 7.4. Emotion Calculation Method
    • 7.5. Display
    • 7.6. Section Selection
  • 8. “Cardio Domain” Interface
    • 8.1. Purpose
    • 8.2. Interface Structure
    • 8.3. Controls
    • 8.4. Extraction of RR Intervals
    • 8.5. HRV Parameters
    • 8.6. Visualization
    • 8.7. Data Export
  • 9. Conclusion
    • Conclusion
    • 9.1. Recommendations for Use
    • 9.2. Additional Resources
    • 9.3. Beginner’s Guide
View Categories
  • Home
  • Docs
  • Stressonika - Guide for Working with raw ECG data
  • Chapter 2. Cardio domain
  • Sector. 2

Sector. 2

1 min read


Sector 2 reflects the respondent’s anthropometric data.

Anthropometric data are sometimes useful during a consultation. With experience, you will learn to notice certain details in the respondent’s behavior during testing and their reaction to your dialogue, and then your conclusions or recommendations may also involve the data of this sector. Among the important ones, you can single out age, body weight (height is needed to calculate body mass index), and sex.

This sector does not require special explanations, except for one point (Fig. 2.7).
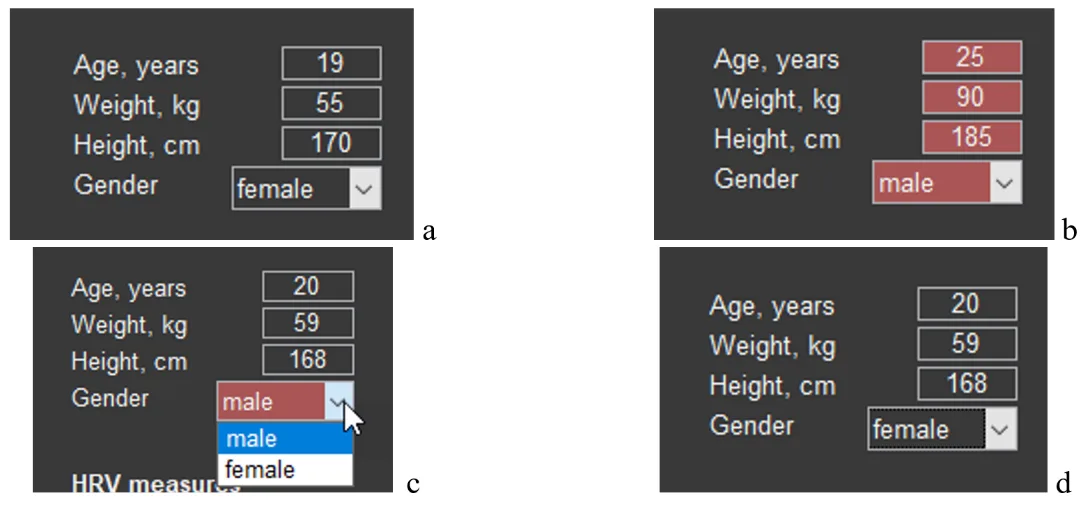
Figure 2.7. A sector on the screen with the respondent’s anthropometric data (explanations in the text).

Data on the number of full years, weight, height, and sex can be displayed in the main tone of the screen (Fig. 2.7a) or in red (Fig. 2.7b). Red is always a warning color: these data do not correspond to the respondent. Such cases can occur, for example, when you changed the names of the main files, accidentally deleted the file for storing these data in the “SAVED DATA” directory (remember our warnings?) or activated with CleverView a file from another location. The possibility of correctly assessing results related to HRV is possible only with reference to the data of sector 3. Therefore, if you need data for a particular person and the cells of the sector are colored red, enter them manually (age, weight and height) and, using the arrow (Fig. 2.7c), specify sex. The result obtained is shown in Figure 2.7d.

It remains to do a recalculation. Press the arrow of sector 1 (Fig. 2.4). Now the HRV data from sector 3 can be saved for further work with them.

Updated on 01.03.2026

What are your Feelings

  • Happy
  • Normal
  • Sad

Share This Article :

  • Facebook
  • X
  • LinkedIn
  • Pinterest
Sector. 1Sector. 3

Our mission

Our mission is to develop products that heighten user awareness of the pivotal role physiology plays in personal and professional endeavors.

We strive to empower our users with the tools to effectively manage stress, prevent burnout, and optimize their well-being.

Contacts

CleverPoint Team - 133, Domaniewska 17/19 Warsawa, Poland, 02-672


+48 578 202 208
[email protected]


All rights reserved. CleverPoint