
Cardio domainCardio domainCardio domainCardio domain
  • Book a demo
  • CleverLab
  • Stressonika
    • Use cases
  • Docs
  • Contacts
  • EN
✕

CleverPoint 4 User Manual

16
  • Introduction
    • Customer Support
    • Regulatory Compliance
    • Warranty and Copyright
  • Product Information
    • Product information
    • Technical specifications
    • Application compatibility
    • Safety precautions
    • Maintenance
  • Getting Started
    • Kit contains
    • Equipment Check
    • Types of CleverPoint 4 Indications
    • Charging your CleverPoint 4
    • Turning CleverPoint 4 on/off
    • First time Wi-Fi setup
    • Connecting CleverMask to the VR Headset
    • Connecting the ECG cable to CleverPoint 4

Stressonika - Guide for Working with raw ECG data

20
  • Introduction
  • Chapter 1. General points.
    • General points
  • Chapter 2. Cardio domain
    • Cardio domain
    • Sector. 1
    • Sector. 2
    • Sector. 3
    • Sector 4
    • Sector 5
    • Sector 6
    • Sector 7
    • Sector 8
  • Chapter 3. Cardio domain: examples
    • Cardio domain: examples
    • 3.1. ECG recording quality
    • 3.2. Preparing the “Cardio domain” page for consultation
    • 3.3 Viewing the “Cardio domain” page during consultation (Example 1)
    • 3.4 . Viewing the “Cardio domain” page during consultation (Example 2)
    • 3.5. Viewing the “Cardio domain” page during consultation (Example 3)
    • 3.6 . Viewing the “Cardio domain” page during consultation (Example 4)
    • 3.7. Viewing the “Cardio domain” page during consultation (Example 5)
    • 3.8. The “Cardio domain” page. Conclusion.

CleverPoint View Data v2.15 User Guide

55
  • Introduction
    • Introduction
  • 0. Fundamentals of Electrophysiology for Beginners
    • 0.1. What Are Physiological Signals?
    • 0.2. Autonomic Nervous System (ANS)
    • 0.3. Emotions and the Brain
    • 0.4. Electrodes and Their Placement in the CleverPoint Setup
  • 1. General Principles of Signal Processing
    • 1.1. Basic Transformations
    • 1.2. Marking and Trim
    • 1.3. CAR (Common Average Reference)
    • 1.4. Denoise (Blink Artifact Suppression)
    • 1.5. Normalize
    • 1.6. IMF (Empirical Mode Decomposition)
    • 1.7. Filtering
    • 1.8. Power vs Amplitude
    • 1.9. Epoch
  • 2. “Summary” Interface
    • 2.1. Purpose
    • 2.2. Controls
    • 2.3. Graphs
    • 2.4. Data Export
  • 3. “Time Domain” Interface
    • 3.1. Purpose
    • 3.2. Controls
    • 3.3. Signal Display
    • 3.4. Signal Transformations
  • 4. “Frequency Domain” Interface
    • 4.1. Purpose
    • 4.2. Interface Structure
    • 4.3. Controls
    • 4.4. Spectral Analysis Methods
    • 4.5. Channel Correlation
    • 4.6. Time Series
  • 5. “Power Domain” Interface
    • 5.1. Purpose
    • 5.2. “Power by sections” Mode
    • 5.3. “Between-channel interactions” Mode
    • 5.4. Frequency-Band Graphs
  • 6. “Coherence” Interface
    • 6.1. Purpose
    • 6.2. Controls
    • 6.3. Coherence Calculation Method
    • 6.4. Display
    • 6.5. Interpretation
    • 6.6. Use in Research
  • 7. “Emotional State” Interface
    • 7.1. Purpose
    • 7.2. Interface Structure
    • 7.3. Controls
    • 7.4. Emotion Calculation Method
    • 7.5. Display
    • 7.6. Section Selection
  • 8. “Cardio Domain” Interface
    • 8.1. Purpose
    • 8.2. Interface Structure
    • 8.3. Controls
    • 8.4. Extraction of RR Intervals
    • 8.5. HRV Parameters
    • 8.6. Visualization
    • 8.7. Data Export
  • 9. Conclusion
    • Conclusion
    • 9.1. Recommendations for Use
    • 9.2. Additional Resources
    • 9.3. Beginner’s Guide
View Categories
  • Home
  • Docs
  • Stressonika - Guide for Working with raw ECG data
  • Chapter 2. Cardio domain
  • Cardio domain

Cardio domain

1 min read

Let us begin with the “Cardio domain” page. This page is a visual illustration of the respondent’s general psychophysiological state. When you gain experience and have “looked at” images of this page from different people, you will be able, just by looking at these graphs and numbers, to build your dialogue with the respondent in a reasoned way, emphasizing the report data with objective graphs of a person’s physiological response to one or another task in Stressonika.

If you work with other VR content, the statement about “reasoned construction of dialogue” retains its force. If you do not work as a consultant and your activity is more related to scientific work, viewing this page is also extremely useful for forming preliminary conclusions.

There is another important point that should be highlighted separately: the visual series of this page will immediately indicate to you how well the data collection was carried out (on this page, as we have already indicated, 5 graphs and digital data related to HRV are visualized, which is based on the ECG curve). Examples of poor-quality recordings or recordings with non-critical defects and how to react to this, we will consider below. For now, let us analyze the “Cardio domain” page using the example of a good ECG recording. For the convenience of studying work with this page, we divided it into 8 sectors (Fig. 2.1).
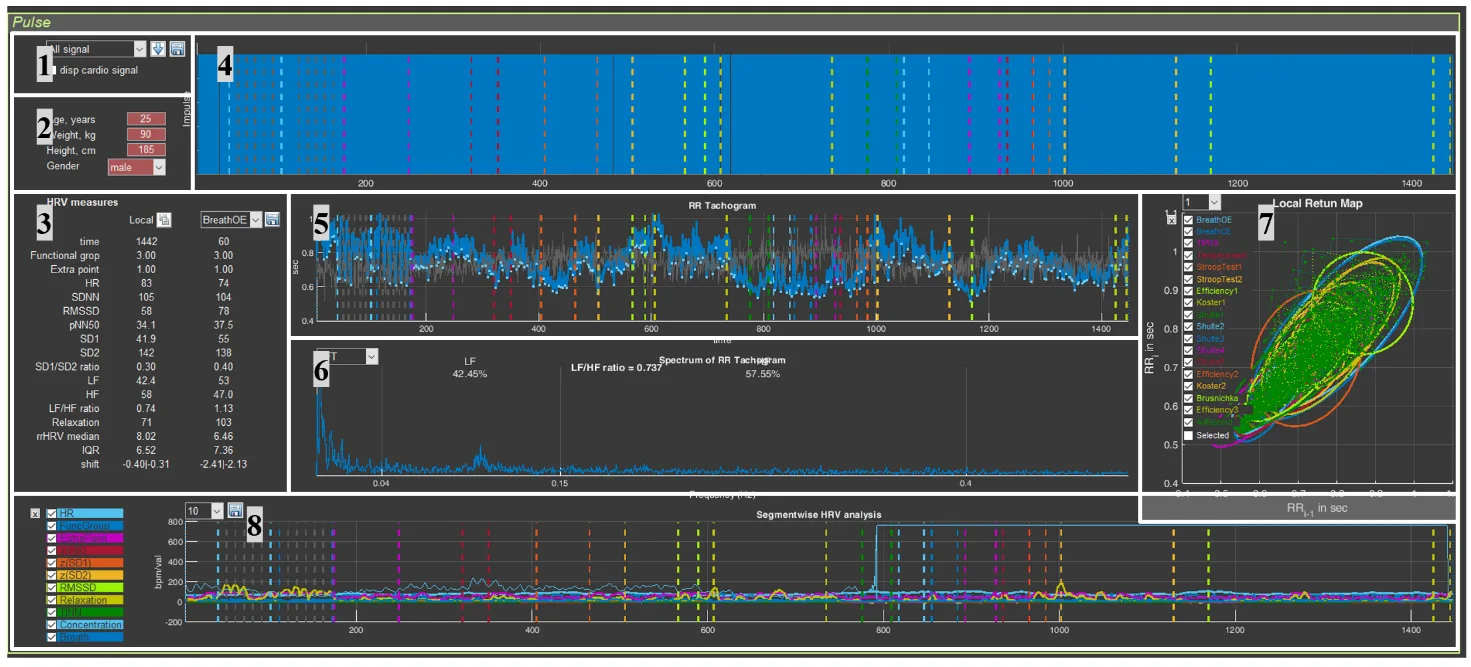
Figure 2.1. “Cardio Domain” page for a loaded file with raw data (explanations in the text)

Highlighting the sectors is an extremely conditional measure, since they are interconnected and changing one can affect another; therefore, the illustration of our actions will be such that you can see these interconnections.

Now, perhaps, we can consider each sector in more detail.

Updated on 01.03.2026

What are your Feelings

  • Happy
  • Normal
  • Sad

Share This Article :

  • Facebook
  • X
  • LinkedIn
  • Pinterest
Sector 8Sector. 1

Our mission

Our mission is to develop products that heighten user awareness of the pivotal role physiology plays in personal and professional endeavors.

We strive to empower our users with the tools to effectively manage stress, prevent burnout, and optimize their well-being.

Contacts

CleverPoint Team - 133, Domaniewska 17/19 Warsawa, Poland, 02-672


+48 578 202 208
[email protected]


All rights reserved. CleverPoint