
In sector 8, by default, graphs are combined that reflect the dynamics of a fairly large number of calculated indicators of a person’s functional state (Fig. 2.26).

Figure 2.26. Graphs of sector 8
We remind you that the scales of the graphs in Sectors 5 and 8 are interdependent: selecting a segment of the cardiointervalogram (CIG) in Sector 5 results in selecting the same segment on the screen in Sector 8. Likewise, selecting a segment of the graph in Sector 8 results in selecting the same segment on the screen in Sector 5.
Definitions of the sector graphs and their color marking are presented in Table 2.

| Table 2. Graphs of sector 8 and their definition |
| Heart rate (see Table 1). |
| Functional group (see Table 1). |
| Number of adjustment criteria (see Table 1). |
| Z index for HR |
| Z index for SD1 |
| Z index for SD2 |
| HRV measure (see Table 1). |
| Severity of the resting state. |
| One of the measures of distribution of RR-interval duration. |
| Severity of the concentration state. |
| Respiration rate. |
Most of the indicators have already been described above. “New” for you may be the indicators z(HR), z(SD1), z(SD2) and TINN. The z index for the HR, SD1 and SD2 indicators shows how the respondent’s result relates to the values of the same indicator among all persons of the same age and sex. The definition of the TINN indicator, or triangular index, is complex: the integral of the distribution density divided by the maximum of the distribution density. It is clear that monitoring it is intended for scientific activity.
Now let us consolidate the already familiar skills of using the functional capabilities for controlling the image. Click on the cross in the upper left corner of the panel with the list of graphs in sector 8 (see the figure in Table 2). As we remember, it clears all images on the plot (Fig. 2.27a). Activate the graph of the indicator that interests us, for example, HR (Fig. 2.27b). Using the “+” icon (“Zoom In”), scale the graph along the vertical axis so that the dynamics of the indicator are visible (Fig. 2.27c).
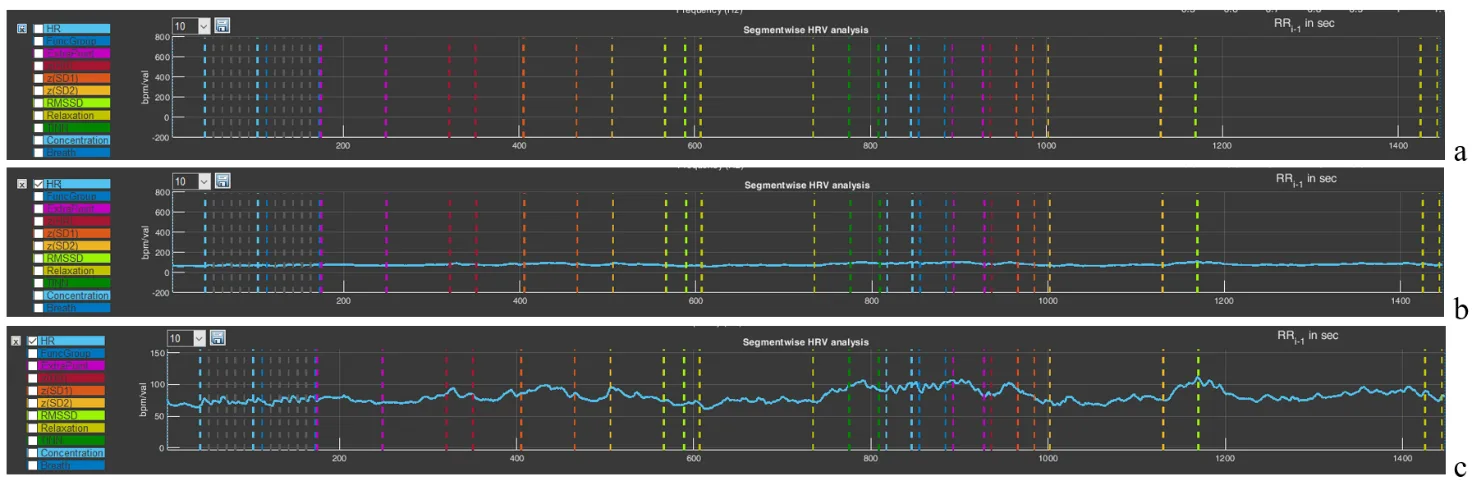
Figure 2.27. Selecting a graph in sector 8 (explanations in the text)
The window with the number 10 will allow you to build a graph with averaging of the number of points specified in the window. By default, a graph is built with averaging of 10 points. But you can select a larger number of points for averaging (Fig. 2.28a). This will lead to “smoothing” of the graph (Fig. 2.28b), which is sometimes useful if the spread of instantaneous values is large, which makes it difficult to see the general trend of changes in the indicator during a VR session.
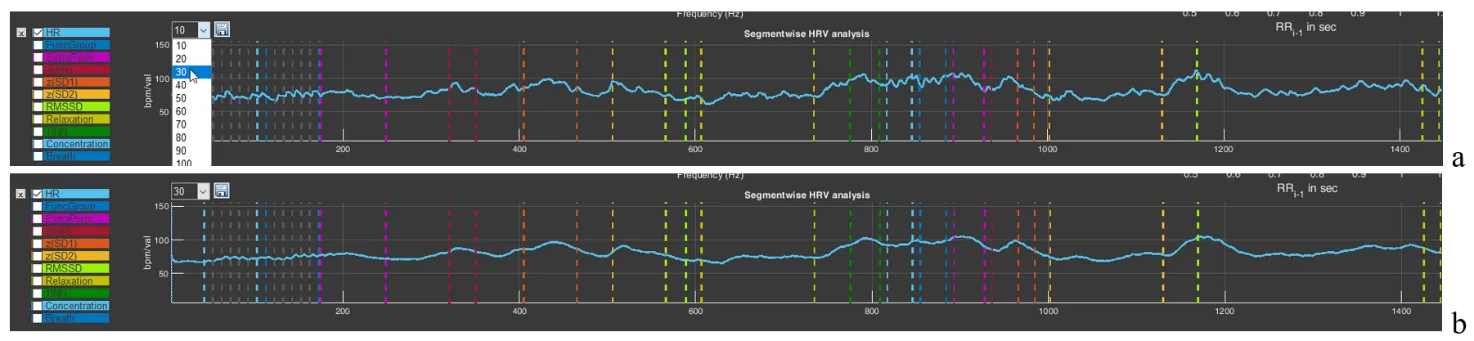
Figure 2.28. Graph smoothing function in sector 8 (explanations in the text)
You can “play” with the averaging value and see how the graph changes. At the same time, you can practice using the functional icons in the upper-right corner.
The last functional icon in the form of a floppy disk is also familiar to you: the function of saving data in tabular form. Press it (Fig. 2.29a). You are prompted to save the data under the name of the main file with “_L” added (Fig. 2.29a). Save it. A file with a “tail” in the name “_L10” will appear in the main folder (Fig. 2.29b). 10 is the value of the averaged number active in the window we told you about above. If you select, for example, the value “30” there, then your file will be saved with the “tail” “_L30” in the name (Fig. 2.29d).
Now let us consider how the saved data look in Excel (Fig. 2.29c). Regardless of which graph is activated and which stage is displayed in the sector, the saved file will contain data for all indicators for the entire testing time. Two points that you need to focus your attention on: 1) the functional group is marked on the graph not as 1,2,3 – 9, but as 10, 20, 30 – 90 (this is done for better visualization); 2) if there is no number in a cell and “NaN” is indicated, this means that the indicator could not be calculated at that moment (Fig. 2.29c).
We remind you that the name under which you will save files is your decision. We also remember the symbol that defines the decimal fraction with which the primary data will be saved, and how to specify it (by default, it is “.”).
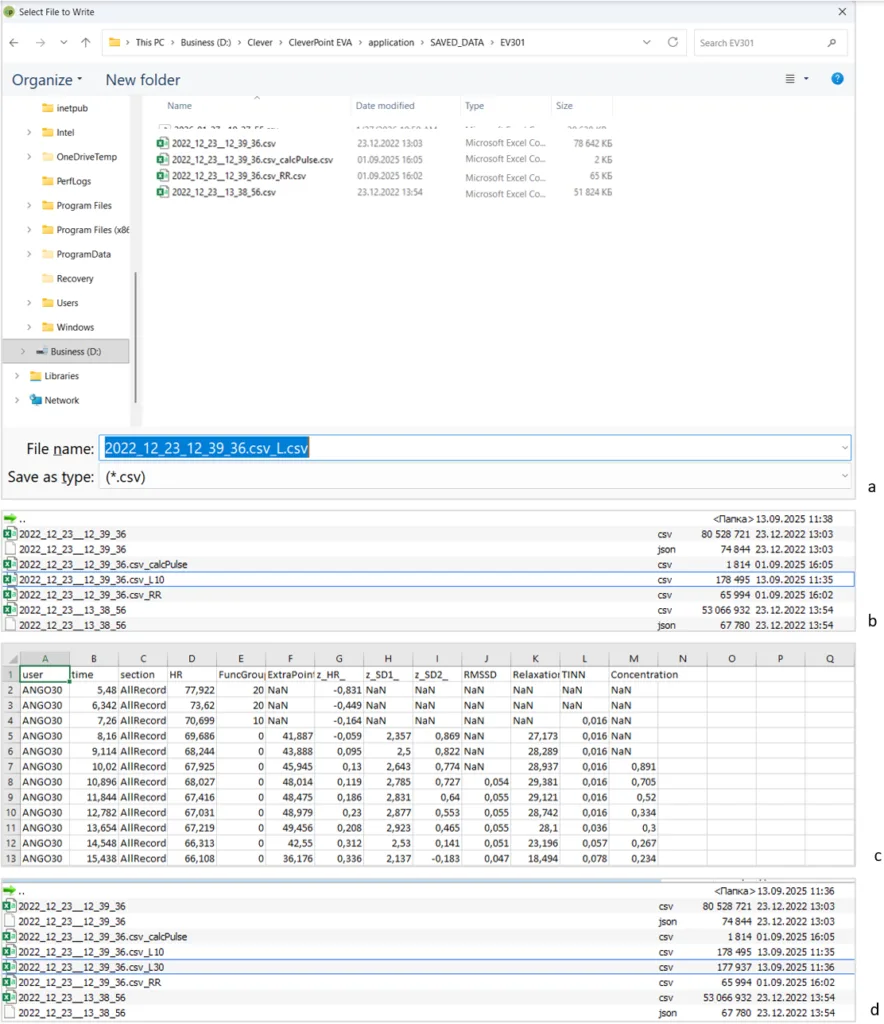
Figure 2.29. Sequence of actions for saving RR-interval data (explanations in the text)
This chapter is perhaps the most difficult, and if you have reached this page, please accept our congratulations!
In the next chapter, we will again work in the “Cardio domain” area, but already in conjunction with the report and examples for analysis and conclusions. The skill of working with “Cardio domain” data is extremely important both for a consultant and for scientific work, unlike other pages of the CleverView program, which are more oriented toward scientific research. Therefore, for now we remain on this page.


