
Sector 5Sector 5Sector 5Sector 5
  • Book a demo
  • CleverLab
  • Stressonika
    • Use cases
  • Docs
  • Contacts
  • EN
✕

CleverPoint 4 User Manual

16
  • Introduction
    • Customer Support
    • Regulatory Compliance
    • Warranty and Copyright
  • Product Information
    • Product information
    • Technical specifications
    • Application compatibility
    • Safety precautions
    • Maintenance
  • Getting Started
    • Kit contains
    • Equipment Check
    • Types of CleverPoint 4 Indications
    • Charging your CleverPoint 4
    • Turning CleverPoint 4 on/off
    • First time Wi-Fi setup
    • Connecting CleverMask to the VR Headset
    • Connecting the ECG cable to CleverPoint 4

Stressonika - Guide for Working with raw ECG data

20
  • Introduction
  • Chapter 1. General points.
    • General points
  • Chapter 2. Cardio domain
    • Cardio domain
    • Sector. 1
    • Sector. 2
    • Sector. 3
    • Sector 4
    • Sector 5
    • Sector 6
    • Sector 7
    • Sector 8
  • Chapter 3. Cardio domain: examples
    • Cardio domain: examples
    • 3.1. ECG recording quality
    • 3.2. Preparing the “Cardio domain” page for consultation
    • 3.3 Viewing the “Cardio domain” page during consultation (Example 1)
    • 3.4 . Viewing the “Cardio domain” page during consultation (Example 2)
    • 3.5. Viewing the “Cardio domain” page during consultation (Example 3)
    • 3.6 . Viewing the “Cardio domain” page during consultation (Example 4)
    • 3.7. Viewing the “Cardio domain” page during consultation (Example 5)
    • 3.8. The “Cardio domain” page. Conclusion.

CleverPoint View Data v2.15 User Guide

55
  • Introduction
    • Introduction
  • 0. Fundamentals of Electrophysiology for Beginners
    • 0.1. What Are Physiological Signals?
    • 0.2. Autonomic Nervous System (ANS)
    • 0.3. Emotions and the Brain
    • 0.4. Electrodes and Their Placement in the CleverPoint Setup
  • 1. General Principles of Signal Processing
    • 1.1. Basic Transformations
    • 1.2. Marking and Trim
    • 1.3. CAR (Common Average Reference)
    • 1.4. Denoise (Blink Artifact Suppression)
    • 1.5. Normalize
    • 1.6. IMF (Empirical Mode Decomposition)
    • 1.7. Filtering
    • 1.8. Power vs Amplitude
    • 1.9. Epoch
  • 2. “Summary” Interface
    • 2.1. Purpose
    • 2.2. Controls
    • 2.3. Graphs
    • 2.4. Data Export
  • 3. “Time Domain” Interface
    • 3.1. Purpose
    • 3.2. Controls
    • 3.3. Signal Display
    • 3.4. Signal Transformations
  • 4. “Frequency Domain” Interface
    • 4.1. Purpose
    • 4.2. Interface Structure
    • 4.3. Controls
    • 4.4. Spectral Analysis Methods
    • 4.5. Channel Correlation
    • 4.6. Time Series
  • 5. “Power Domain” Interface
    • 5.1. Purpose
    • 5.2. “Power by sections” Mode
    • 5.3. “Between-channel interactions” Mode
    • 5.4. Frequency-Band Graphs
  • 6. “Coherence” Interface
    • 6.1. Purpose
    • 6.2. Controls
    • 6.3. Coherence Calculation Method
    • 6.4. Display
    • 6.5. Interpretation
    • 6.6. Use in Research
  • 7. “Emotional State” Interface
    • 7.1. Purpose
    • 7.2. Interface Structure
    • 7.3. Controls
    • 7.4. Emotion Calculation Method
    • 7.5. Display
    • 7.6. Section Selection
  • 8. “Cardio Domain” Interface
    • 8.1. Purpose
    • 8.2. Interface Structure
    • 8.3. Controls
    • 8.4. Extraction of RR Intervals
    • 8.5. HRV Parameters
    • 8.6. Visualization
    • 8.7. Data Export
  • 9. Conclusion
    • Conclusion
    • 9.1. Recommendations for Use
    • 9.2. Additional Resources
    • 9.3. Beginner’s Guide
View Categories
  • Home
  • Docs
  • Stressonika - Guide for Working with raw ECG data
  • Chapter 2. Cardio domain
  • Sector 5

Sector 5

4 min read

Sector 5 displays a cardiointervalogram (CIG), which reflects the dynamics of RR intervals (Fig. 2.18b). We already mentioned the CIG when we talked about HRV. This curve is a visual illustration of HRV as a whole. Let us consider it in more detail.
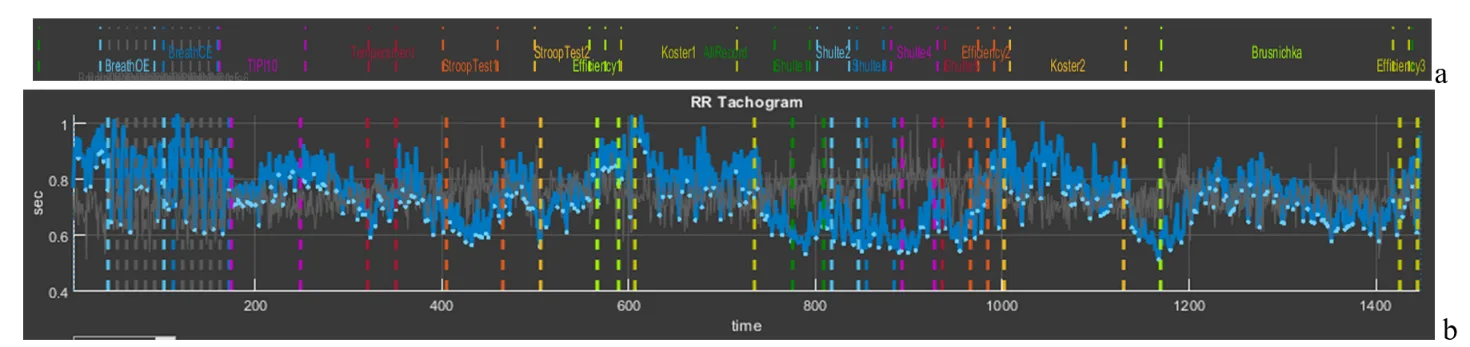
Figure 2.18. Cardiointervalogram for the entire study period

On the horizontal axis (“time”), the study time is plotted; on the vertical axis, the value of the RR interval (in our figure from 1 s to 0,4 s). We draw your attention to the fact that the shorter the RR interval, the higher the HR, and vice versa (1 s corresponds to 60 beats/min, 0,4 s – 150 beats/min). Therefore, you need to get used to this curve in order to interpret it correctly: if the CIG curve crawls upward, it means that the heart began to beat less frequently; downward – faster. A few more points for evaluating the curve of sector 5: a wide curve – high HRV, a narrow one – low; a flat curve – an inert regulatory system that ensures the work of the heart; pronounced fluctuations in the level of RR intervals (as in Fig. 2.18) – a mobile one.

We also remind you of the color marking of the study stages. For a better idea of where which stages are, we supplemented Fig. 2.18 with Fig. 1.5 from the “Time domain” page (Fig. 2.8a). Let us draw your attention to the stages with slow breathing (6 breathing movements per minute), the stage for the speed of pressing the controller key (“Temperament”), the stages with cognitive load (“Stroop” 1,2, “Shulte” 1-5 and “Brusnichka”), and the stages where the respondent was offered to rest (“Koster” 1 and 2). We will return to Fig. 2.18b in the next chapter; for now we only note how the duration of RR intervals changes, and, consequently, HR.

And let us also consolidate, using the example of this sector, the work with the functional icons. Move the cursor to the upper right corner and select “Zoom In” (Fig. 2.19a). Now, along the horizontal axis, select the stage of slow breathing with open eyes “BreathOE”, marked with light-blue dashed vertical lines. As a result, only this stage is selected on our screen in sector 5 (Fig. 2.19b). It can be seen how HRV has “swung” against the background of such breathing, especially at its beginning (the dependence of HRV on breathing is a normal phenomenon and is called respiratory arrhythmia). Now press “Restore View”, the CIG returns to its original form, and now select the stage of slow breathing with closed eyes “BreathCE” (Fig. 2.19c). If we compare the stages of slow breathing with open and closed eyes, it is noticeable that during closed eyes HRV is more stable and throughout coincides with the phases of breathing. However, if we mark reference points on the curve (in our case we chose the lowest values of the respiratory arrhythmia wave) at the beginning of the test and at the end using the “Data Tips” icon, we will see that the RR interval decreases from 0,708 s (or ≈85 beats/min) to 0,604 s (or ≈99 beats/min) (Fig. 2.9c), i.e., the already increased heartbeat begins to beat even more often. It can be assumed (we emphasize, “assumed”) that the test with controlled slow breathing is performed by the respondent with strain; however, the heart-rate regulation system responds to slow breathing with a frequency of 6 breathing movements per minute: between the vertical dashed blue lines (the duration of the “BreathCE” stage is 1 minute) 6 waves of oscillations in the duration of RR intervals are visible, which indicates a relatively synchronous “work” of the external respiration systems and the control of heart contractions (Fig. 2.19c).
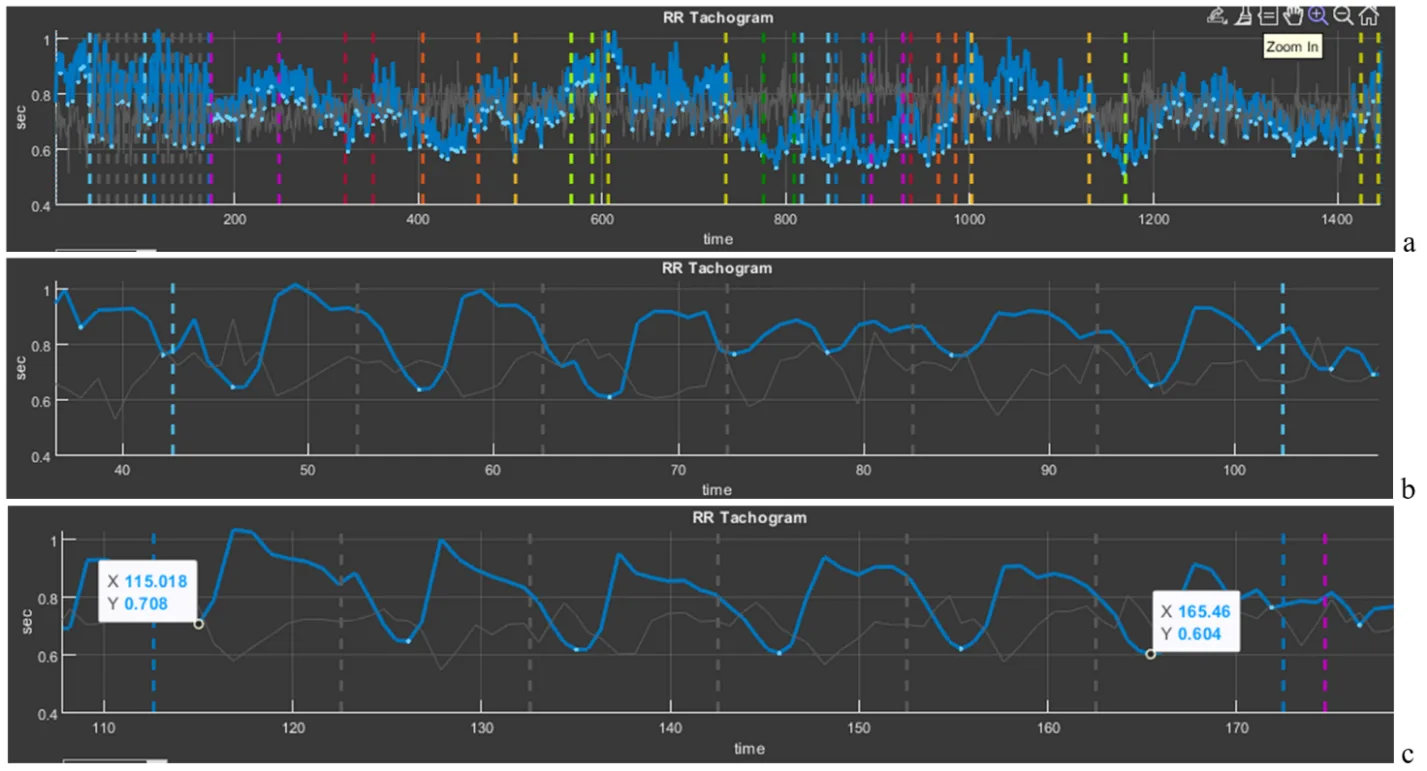
Figure 2.19. Selection of cardiointervalograms at slow breathing stages (explanations in the text)
Above we provided a modest example of the possibility of interpreting data of a person’s physiological response to tasks in VR (in our examples, this is a response to tests in Stressonika), which can be done using CleverView. We will “work” with examples in more detail and in greater depth in the next chapter.

Please note that Sector 5 is linked to Sector 8: selecting a segment of the cardiointervalogram (CIG) in Sector 5 results in selecting the same segment on the screen in Sector 8. Likewise, selecting a segment of the graph in Sector 8 results in selecting the same segment on the screen in Sector 5.

Updated on 01.03.2026

What are your Feelings

  • Happy
  • Normal
  • Sad

Share This Article :

  • Facebook
  • X
  • LinkedIn
  • Pinterest
Sector 4Sector 6

Our mission

Our mission is to develop products that heighten user awareness of the pivotal role physiology plays in personal and professional endeavors.

We strive to empower our users with the tools to effectively manage stress, prevent burnout, and optimize their well-being.

Contacts

CleverPoint Team - 133, Domaniewska 17/19 Warsawa, Poland, 02-672


+48 578 202 208
[email protected]


All rights reserved. CleverPoint